

bandsintown insights
The Bandsintown Insights tab is a great way for artists to know exactly how their account is performing and fans are responding to their interactions, so they can make informed decisions. Apart from being able to get useful data on your followers across different platforms, top markets your fans are at and ticket clicks, you also get insightful reports on your Events Promotion Page and you will be able to track your fans, events, ticket clicks, RSVPs and more, by location. These and other useful tools are available for FREE, and you can find them on the left bar menu on your Bandsintown account Homepage.

All the data displayed can be downloaded in a CSV report, so you can better manipulate and filter this information. The mobile-friendly version also lets you view your analytics on the go.
We’ve divided the features into different sections and we’ve added useful details on each of them on the following segments, so just keep scrolling down:
Summary
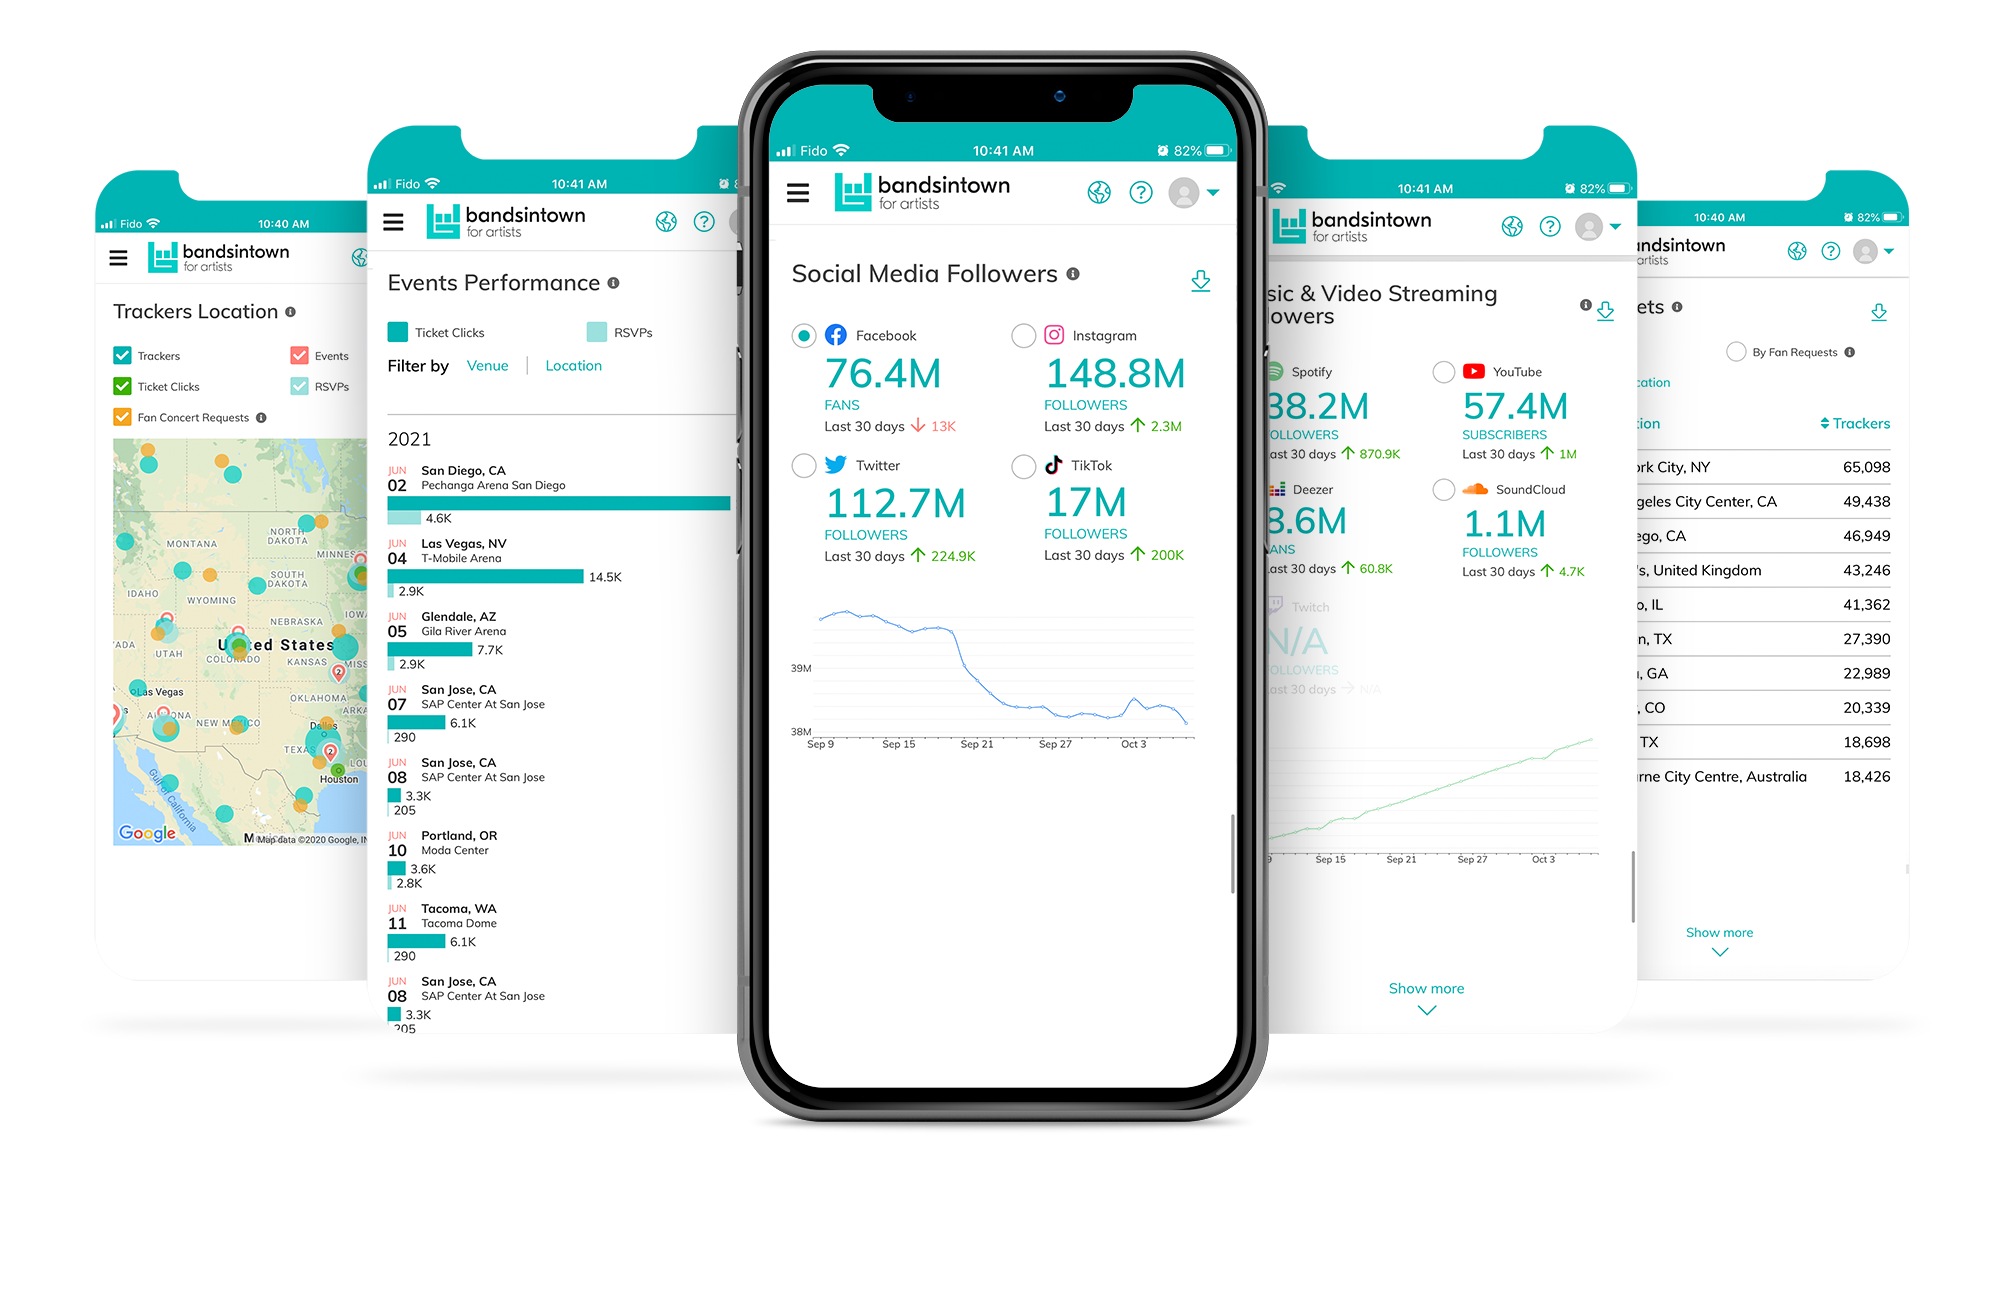
When on the Insights page, the first thing you’ll see at the top of the page is a summary with the total number of followers, RSVPs and Ticket Clicks, as well as a variation gathered in the last 30 days. This overview is very useful to get a good idea of what’s going on on your account - at a glance.

trackers
The Trackers section offers you the possibility to visualize the total number of followers you’ve gained by different time ranges, such as ‘Last 7 days’, ‘Last 4 weeks’ and ‘Last 12 months’. This information will provide you with a complete understanding of your Bandsintown account performance in the short, medium or long terms.
Bandsintown trackers are automatically notified by email and push notification each time you share an update or publish a new event, increasing event promotion, fan engagement, and assuring they won’t miss next time you’re performing live.
This chart will also give your monthly progression over the last 12 months so you can measure the results of your fan acquisition strategies and make more informed decisions.

Trackers Location
This dashboard will give artists a visual representation of where their followers, upcoming events, ticket clicks, RSVPs and fan requests are at. All you need to do is specify a location by country, state/province or city, and the map will show the data, represented by different colors.

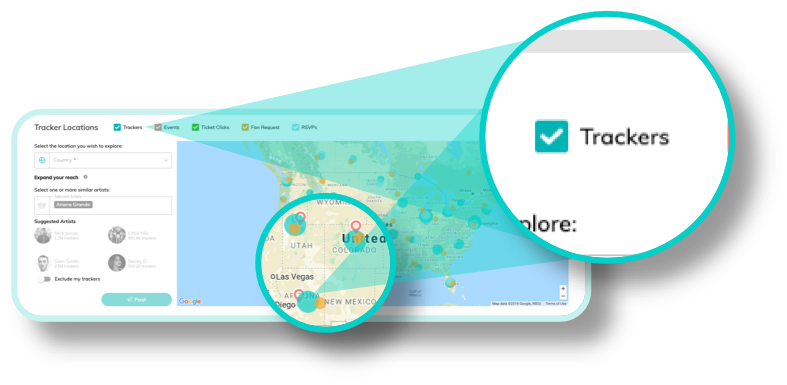
After you’ve chosen the location, clicking on the button ‘Post’ will open the ‘Target by Location’ dialogue so you can send a geo-targeted post to your own trackers. You can also expand your reach by selecting one or more similar artists that the platform will automatically display, based on the location previously selected. This is a cool way to easily promote your events or your music to new potential fans that are not yet following you. By clicking on ‘Launch Campaign’, you’ll be redirected to the Campaigns tab where the previous info will be automatically populated, so you can easily set up an email marketing campaign targeting these specific fans (this is a paid feature).

Top Markets
This is where you can find the locations of your top markets. You can sort the data by 2 different criteria: ‘By trackers’ or ‘By Fan Requests’. ‘By trackers’ represents the location you have the highest number of followers and ‘By Fan Requests’ shows the places your fans would love you to perform.

You can also filter the information by location, which is extremely useful if you want to know these numbers based on a specific country, for example.
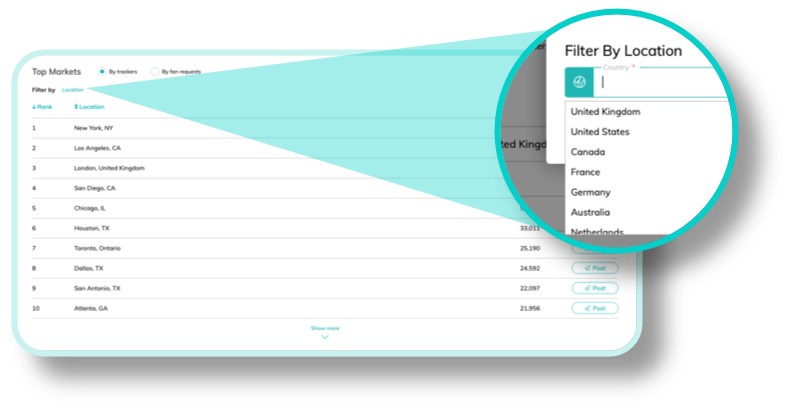
We’ve added an easy shortcut for you to send messages to these fans based on your previous selection. By clicking on the ‘Post’ button, you’ll be taken to the ‘Posts’ tab with pre-populated fields according to your filters (VIP Feature).

Events performance
The Events Performance section is where artists will be able to easily visualize the number of ticket clicks and RSVPs to each of their shows.


The information can also be filtered by Venue or by Location.

Ticket clicks
This segment shows the number of ticket clicks you’ve achieved. We’ve added 3 different time periods for you to filter this information: ticket clicks over the ‘Last 7 days, over the ‘Last 4 weeks’ or over the ‘Last 12 months’.

events promotion page performance
This section tool will bring you useful stats on your Events Promotion Page, such as the number of views and clicks your page has earned, as well as the Click Rate (represented by the number of Clicks divided by the number of Views). This is a great way for you to quickly overview your promo page’s performance.


And you can also filter your data by several time ranges (‘Last 7 days’, ‘Last 4 weeks’ and ‘Last 12 months’).

SOCIAL MEDIA FOLLOWERS
The ‘Social Media Followers’ section will display your fanbase growth across Facebook, Instagram, Twitter and TikTok in a unique, centralized dashboard. Every time you send these followers a message or post new content, they will get notified by these platforms so they never miss your updates.

You can display this data according to different time ranges, as well as visualize your monthly gain over the last 12 months.


Music & Video Streaming Followers
Have instant access to your daily, weekly or monthly number of followers on your music & streaming platforms such as Spotify, YouTube, Twitch, etc, in a single place. The dashboard also presents your last-30-day growth and the total number of followers, so you can check your monthly performance at a glance.
Your fans are notified by these platforms every time you release new music or video, boosting your promotion efforts and driving engagement.

You can also choose to display your monthly progression over the last 12 months for each of the platforms above.
